
Is the Euro Area hitting capacity constraints? (Martin Ertl)
5 weitere Bilder(mit historischen Bildtexten)

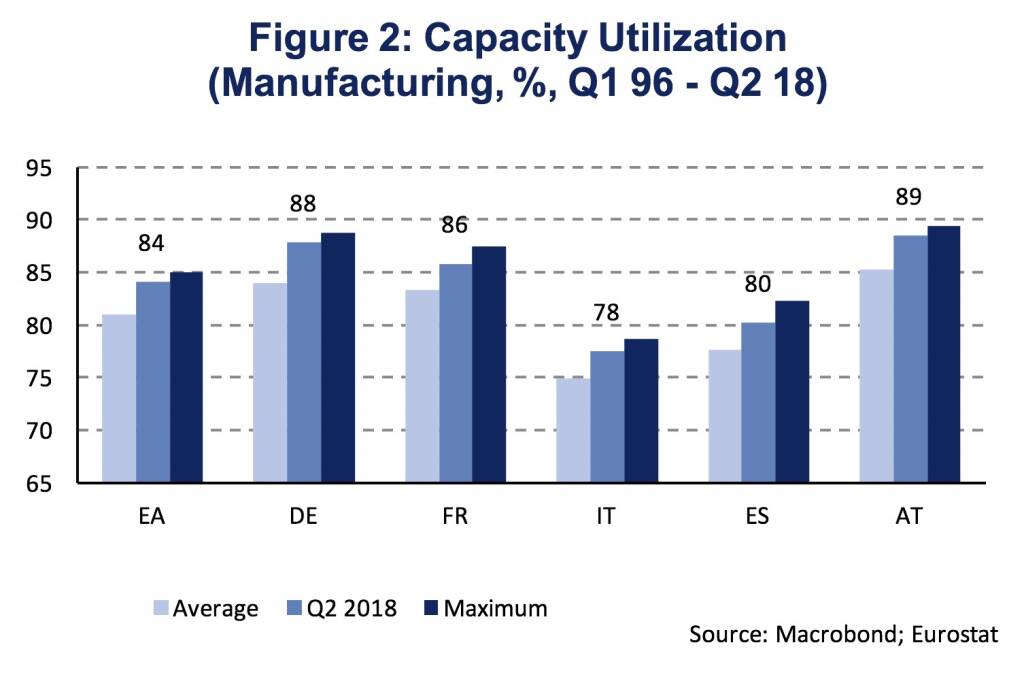
Capacity Utilization

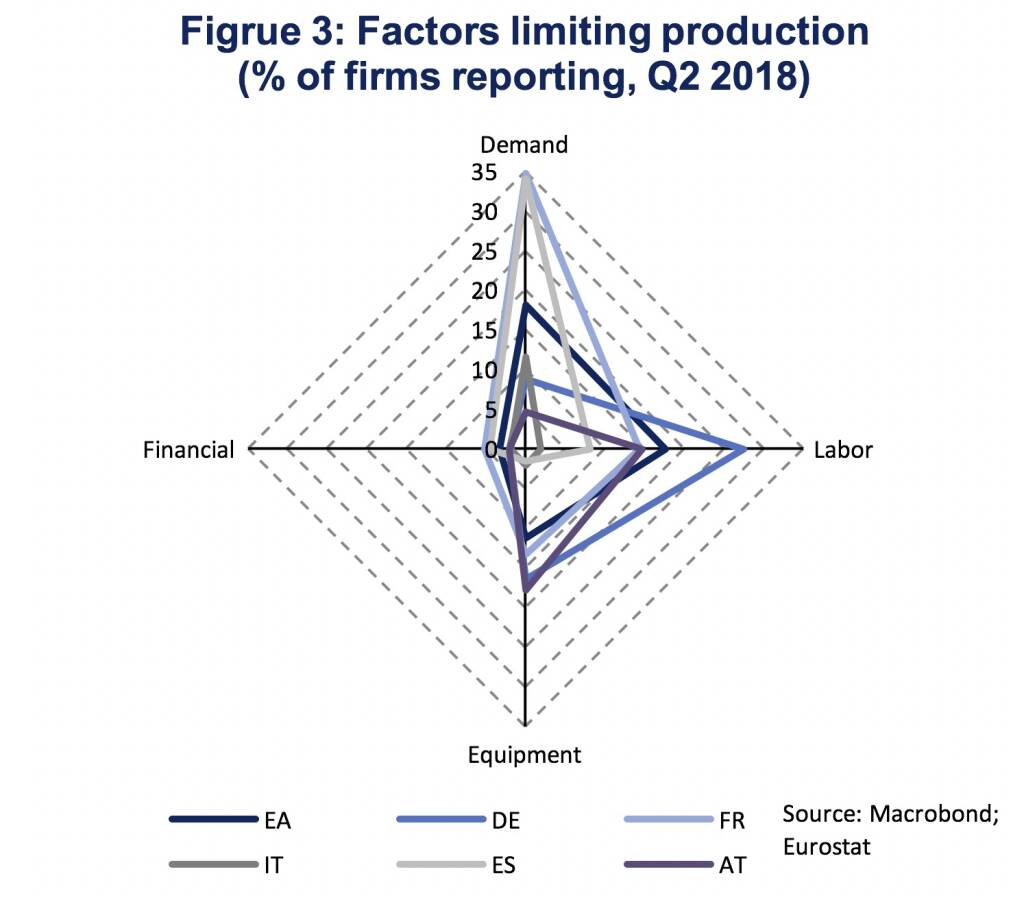
Factors limiting production

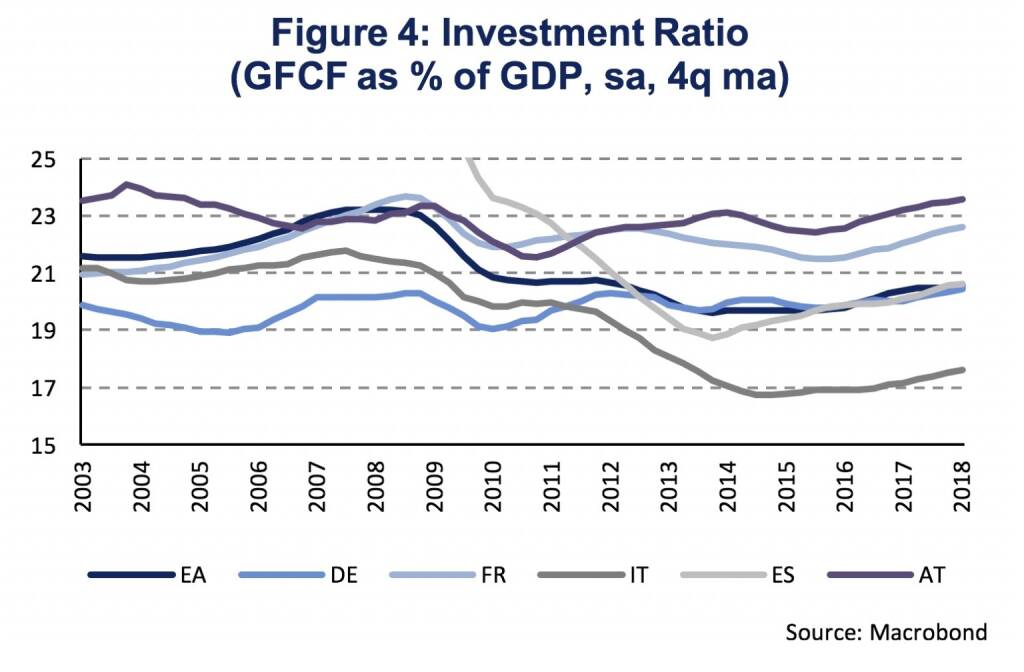
Investment Ratio

Real Labor Productivity Growth

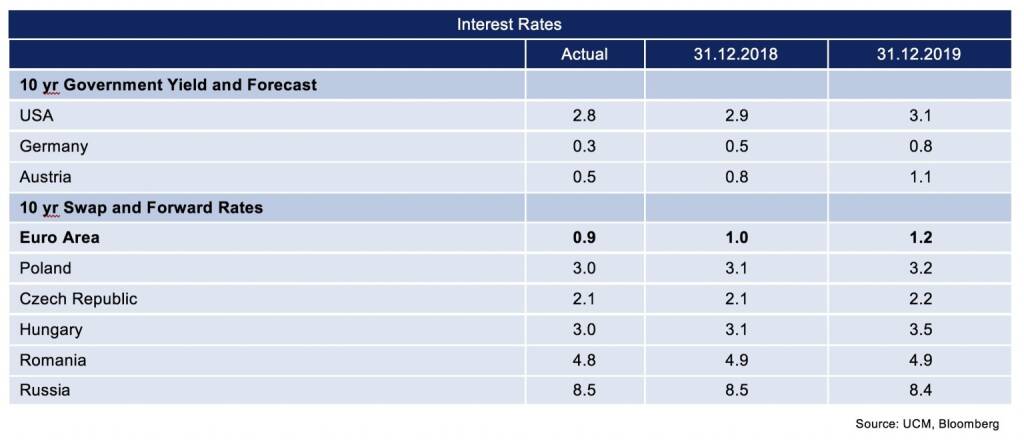
Interest Rates

 Fabrizio Strada
 Dean Garlick
 Matteo Girola
 Olga Ignatovich
 L'électrification de la ligne Paris Le Mans (photos by Roger Schall)
16.07.2018, 7050 Zeichen
- Euro Area GDP growth slowdown is likely to extend into the second quarter, despite a rebound of industrial production in May.
- Capacity utilization has reached levels well above the long-term average and close to 2007.
- Insufficient demand and labor shortages are the most significant factors limiting production.
- Investment activity in the Euro Area has, not yet, reached pre-crisis levels.
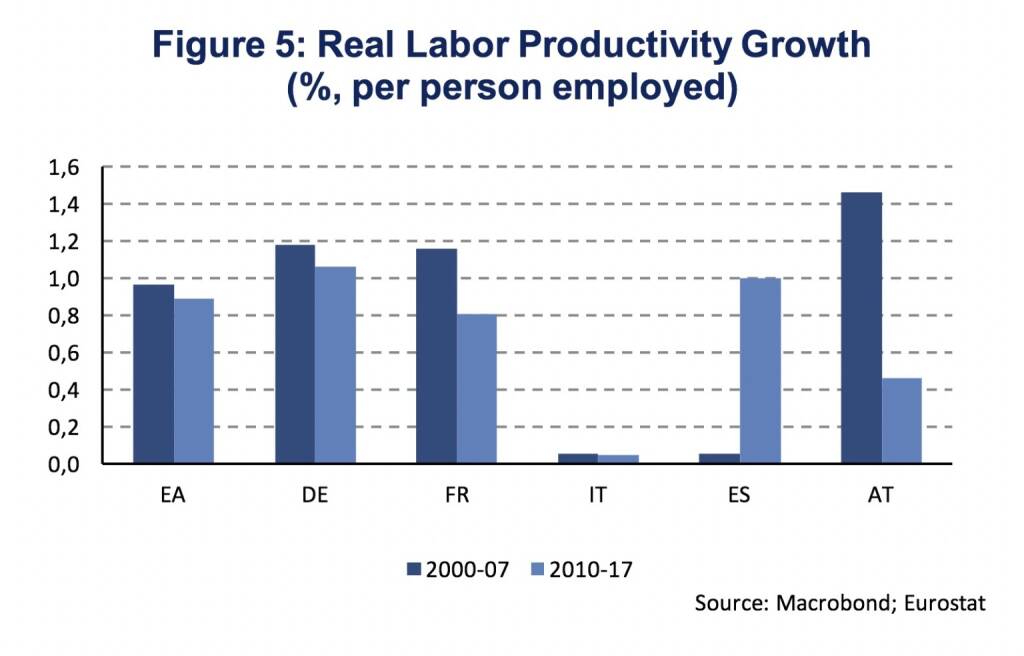
- Labor productivity growth has been remarkably similar between the pre- and post-crisis period, though, at markedly lower employment growth.
Euro Area economic growth slowed down during the first quarter of the year and business cycle indicators, like industrial production, retail sales or sentiment indicators, have, so far, signaled an extension of muted growth into the second quarter. Quarter-on-quarter (q/q) real GDP growth was 0.4 % (seasonally adjusted, sa) in Q1 2018 compared to average growth of 0.7 % (q/q, sa) in 2017. Industrial production was weak in April, even declining compared to March (-0.8 %, m/m, sa). Last week’s industrial production figures for May have been better (1.3 %, m/m, sa), mainly driven by Germany (2.5 %, m/m, sa). Our GDP tracker, which is based on a dynamic factor model for Nowcasting and combines a large set of high frequency indicators, is currently projecting Euro Area GDP growth at 0.3 % (q/q, sa) for the second quarter of 2018 with growth regaining strength recently (Figure 1).
The ECB interprets the slowdown of growth “to some extent […] as a natural development in a maturing expansion after many years of growth above potential”. This view was stated during the June meeting of the ECB’s Governing Council of which the minutes have recently been published. The European Commission estimates Euro Area potential growth at 1.5 % which corresponds to a quarterly growth rate of 0.37 % (2018 European Semester). With growth rates close to potential growth, this line of reasoning would suggest that economic slack, or slack capacity, has become limited. And, indeed, survey based indicators of capacity utilization confirm this picture.
Capacity utilization in the Euro Area has reached 84.1 % in Q2 2018 which is well above its long-term average (81 %) and even close to the maximum degree of capacity utilization, which was reached in Q3 2017 (85 %). Among the four largest Euro Area economies, Germany has reached the highest degree of capacity utilization (88 %), after France (86 %), Spain (80 %) and Italy (78 %). In Austria, the manufacturing industry even produces at 89 % of its capacity (Figure 2).
Looking at the factors, which firms report to limit production, we see a balanced picture in the Euro Area aggregate and distinct differences across individual member states (Figure 3). Insufficient demand is the most important factor limiting production in France and Spain, while labor and capital constraints are more restrictive in Germany and Austria. In the Euro Area aggregate, insufficient demand and labor constraints are the most significant limiting factors being reported by 18 % of firms. However, while insufficient demand is declining in importance, labor shortages are gaining significance.
With demand factors becoming less restrictive and supply factors constraining production, investment activity becomes more vital. Firstly, capital constraints can directly be mitigated by increased investment activity. Secondly, labor shortages can be overcome by substituting labor for capital, thus, increasing labor productivity through capital deepening. And, thirdly, investment can be productivity enhancing by increasing output at given levels of labor and capital, known as total factor productivity.
Investment has not yet, reached pre-crisis levels. Investment, measured as gross fixed capital formation (GFCF), has been growing steadily in the Euro Area since 2016, averaging 4.0 % (y/y, sa). In spite of the acceleration of growth, the level of investment is still 4.4 % below its pre-crisis peak in Q1 2008. The level of GDP, on the other hand, is already 6.4 % above. This indicates that the current expansion has, until now, been characterized by a slow recovery of investment activity. Figure 4 shows the respective investment ratios, which give the nominal value of gross fixed capital formation as a percentage of the nominal value of GDP, for the Euro Area, Germany, France, Italy, Spain and Austria. Investment ratios are highest in Austria (23.5 %) and France (22.7 %) with the Euro Area at 20.7 % in Q1 2018. However, only Germany and Austria have surpassed investment ratios seen in 2008. The Euro Area remains 2.3 %-age point below the 2008 ratio. Spain shows the largest gap (-8.5 %) to the pre-crisis peak, which was, however, driven by a real estate boom. In Italy the gap to 2008 is -3.7 %-age points, so less significant compared to Spain, however, the recovery in investment activity has been less rapid and the investment ratio is substantially lower (17.6 %).
Differences in productivity growth between the pre-crisis (2000-07) and post-crisis (2010-17) period are less substantial as the slow recovery in investment activity would have suggested. Figure 5 shows the growth rate of real labor productivity, which is defined as real GDP over total employment, for the Euro Area, Germany, France, Spain, Italy and Austria. Labor productivity growth has been slower during the post-crisis period for all economies except for Spain. For the Euro Area aggregate, the difference in growth rates is rather small. Between the years 2000 and 2007 average annual growth of real labor productivity was 1.0 % compared to 0.9 % between 2010 and 2017. Differences are less pronounced as the growth of total employment was less substantial (2000-07: 1.3 %, 2010-17: 0.4 %). As employment growth was subdued in the post-crisis period, less investment activity was needed in order to achieve a similar growth rate in labor productivity. The employment effect is most pronounced in Spain, where employment growth was negative (-0.3 %) between 2010 and 2017 compared to average annual growth at 3.7 % between 2000 and 2007.
This short analysis has shown that the Euro Area economy is approaching capacity constraints. Capacity utilization is close to pre-crisis highs and demand constraints are losing importance. The percentage of firms reporting labor and, though to a lesser extent, capital as a factor limiting production is increasing. The recovery in investment activity has been rather slow but has gained some momentum lately. With supply factors becoming scarcer a continuation of the growth momentum in investment activity is needed to boost productivity. Labor productivity growth has been remarkably similar between the pre- and post-crisis period, though, at markedly lower employment growth. Hence, in order to maintain solid economic growth in the medium-term, not accepting potential growth rates to decline any further, investment and productivity will need to perform.
Authors
Martin Ertl Franz Zobl
Chief Economist Economist
UNIQA Capital Markets GmbH UNIQA Capital Markets GmbH

Börsepeople im Podcast S24/21: Hugo Brock
Bildnachweis
1.
GDP nowcast Q2 2018
2.
Capacity Utilization
3.
Factors limiting production
4.
Investment Ratio
5.
Real Labor Productivity Growth
6.
Interest Rates
Aktien auf dem Radar:AT&S, UBM, Strabag, Zumtobel, Lenzing, Agrana, Uniqa, Wolford, RBI, OMV, Porr, Palfinger, Fabasoft, Rosgix, Erste Group, Kapsch TrafficCom, Polytec Group, Wiener Privatbank, Warimpex, Frauenthal, BKS Bank Stamm, Oberbank AG Stamm, Amag, CA Immo, EuroTeleSites AG, CPI Europe AG, Österreichische Post, Semperit, Telekom Austria, Deutsche Post, Caterpillar.
Random Partner
Agrana
Die Agrana Beteiligungs-AG ist ein Nahrungsmittel-Konzern mit Sitz in Wien. Agrana erzeugt Zucker, Stärke, sogenannte Fruchtzubereitungen und Fruchtsaftkonzentrate sowie Bioethanol. Das Unternehmen veredelt landwirtschaftliche Rohstoffe zu vielseitigen industriellen Produkten und beliefert sowohl lokale Produzenten als auch internationale Konzerne, speziell die Nahrungsmittelindustrie.
>> Besuchen Sie 55 weitere Partner auf boerse-social.com/partner
Latest Blogs
» Börse-Inputs auf Spotify zu u.a. Deutsche Telekom, Polytec, Therese Fran...
» Börsepeople im Podcast S24/21: Hugo Brock
» Österreich-Depots: Ultimo April-Bilanz (Depot Kommentar)
» Börsegeschichte 30.4.: MAI, S Immo (Börse Geschichte) (BörseGeschichte)
» Nachlese: Robert Halver (audio cd.at)
» PIR-News: Zahlen von Polytec und Erste Group, Research zu Post und Asta ...
» ATX zum Ultimo zunächst schwächer– Polytec setzt sich Ziel für die Aktie...
» Wiener Börse Party #1146: ATX zum Ultimo zunächst leichter, Polytec top ...
» Wiener Börse zum Ultimo Mittag etwas leichter: Polytec, Frequentis und A...
» ATX-Trends: Andritz, Warimpex, Palfinger, Bawag ...
Useletter
Die Useletter "Morning Xpresso" und "Evening Xtrakt" heben sich deutlich von den gängigen Newslettern ab.
Beispiele ansehen bzw. kostenfrei anmelden. Wichtige Börse-Infos garantiert.
Newsletter abonnieren
Runplugged
Infos über neue Financial Literacy Audio Files für die Runplugged App
(kostenfrei downloaden über http://runplugged.com/spreadit)
per Newsletter erhalten
- Fear of missing out und Jumping the ship bei wiki...
- Börse-Inputs auf Spotify zu u.a. Deutsche Telekom...
- wikifolio Champion per ..: Michael Bichlmeier mit...
- Börsepeople im Podcast S24/21: Hugo Brock
- Wie Ibiden Co.Ltd, 3D Systems, RTL Group, Noratis...
- Wie JinkoSolar, Deutsche Post, Erste Group, Polyt...
Featured Partner Video

Als Österreich-Spezialist zum Rendezvous mit Harry Weygand: Audio-Spur zum Youtube-Ostermontag über ATX-Titel
Das Original mit Bild und Charts: https://www.youtube.com/watch?v=SeZxYkI9VRU
josefchladek.com

Japan, A Photo Theater (English Version
2018
Getsuyosha, bookshop M

Polar Night
2019/2021
Trespasser

ABC Diary
2025
Self published

Typografische Entwurfstechnik
1932
Akadem. Verlag Dr. Fr. Wedekind & Co
 Stephen Gill